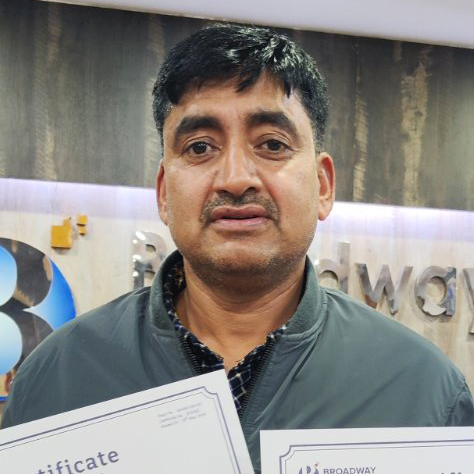
SPSS Training in Nepal

SPSS Training Institute in Kathmandu, Nepal

Duration: 3 Weeks
Career: Data Analyst
Training Mode: Both, Physical & Live Online Classes
Master Your Skills
Become a Professional
Build a Career!
Description

Statistical Package for the Social Sciences (SPSS)

SPSS, originally known as Statistical Package for Social Sciences, has now become a leading, powerful statistical software which is now not just limited to original field but widely used to solve a variety of research and business matters and problems in different field. This is a package of solution designed to expand your analytical knowledge and capabilities providing a range of statistical techniques along with hypothesis testing, analysis and reporting. This ultimately makes it easier to access data, manage them, and then select required techniques to perform analysis and share the final output results.

SPSS training courses provides full coverage of SPSS statistics from fundamentals to data management, statistical analysis with interpretation of results, statistical methods and techniques for survey analysis.

Course Highlights

SPSS training course is specifically designed to support aspiring surveyors, statisticians and professionals involved in research, data management and data analysis. The course is designed for those students who are looking for having a clear idea and make use of SPSS software to perform their statistical works making the data management and analysis easy and accurate. Broadway has designed the standard SPSS learning course that includes basic introduction to SPSS giving you the clear idea of fundamentals and then slowly progress you towards data management and analytical parts. It has really become essential to take help of software with the increasing number and complexity of data nowadays and requirement of quick delivery of results has made it even more essential.

Syllabus outline:

Introduction to fundamentals of SPSS, Introduction to data design, processing from file, edit, data and analysis from transform and analytical necessities, calculating tests and performing analysis  like t-test, correlation, regression, reliability analysis, Chi-square test, Non parametric test, factor analysis and Data Visualization through generation of charts, using chart editor and exporting charts.

Please contact us anytime via email, online forms or our Facebook page to secure your seat for upcoming SPSS training session. For further details, please call or visit our office anytime.

Benefits

Benefits of SPSS Training in Nepal

  • High demand of statistics-focussed individuals
  • Job opportunities after being qualified
  • Chances of interning or working in international companies
  • Statistics specialists are in a high demand in modern Nepal
  • Data gathering and analysis for high-end companies

Benefits of SPSS Training in Broadway Infosys 

  • Personalized feedback on project
  • Wide access to course materials
  • Highly qualified and experienced instructors
  • Motivation and encouragement
  • Regular interaction with experienced Data analysts involved in working with SPSS in their projects
  • Comprehensive training methodology
  • Overall emphasis in practical approach training
  • Proper instruction and guidance for interpretation of statistical results while performing data analysis.

SPSS Training - Outlines
  • A. Installation and SPSS basics introduction.

  • B. Data Design

    • SPSS windows
    • Define data properties.
    • Create data entry template using sample questionnaire.
    • Data entry and cleaning practice.
    • Handling the different formats of the dataset.
  • C. Data Processing

  • I. From File

    • Open new SPSS data & syntax.
    • Save SPSS data, syntax & output.
    • Open data of different format & save in different format.
    • Make data file password protected.
    • Export pivot tables, charts, logs.
    • Generate all variable information and all data value labels in table.
  • II. From Edit

    • Customize the variable view.
    • Insert variables/cases in data.
    • Change the pivot table format.
    • Find & replace.
    • Go to exact variable and case number.
    • Sort ascending descending and multiple variable sorts.
    • Change the file locations to your folder.
    • Shown & Hidden log, notes.. in output.
  • III. From Data

    • Create duplicate dataset.
    • Copy data properties for partial/all dataset.
    • Identify duplicate cases/ identify unusual cases.
    • Sort variables & transpose data.
    • Merge two or more files into one.
    • Define multiple response sets.
      1. Dichotomous
      2. Categories
    • Compare dataset for
      1. Change log
      2. Find accidental modification
    • Use aggregate/ restructure feature.
    • Use feature split file
    • Select cases
      1. Conditional feature selection
      2. Random cases selection ( approximate/ exact sampling)
      3. Use of filter variable
      4. Handle selected cases with same/different/delete features.
    • Weight cases(calculation/application).
  • D. Data Analysis & Interpretations

  • I. From Transform:

    • Generate random numbers.
    • Use recode feature
      1. Automatic recode
      2. Recode in to same variable
      3. Recode in to different variable
    • Use compute variable to compute new variable.
    • Use of string functions.
    • Binning for automatic categorization of data.
    • Date and time wizard
      • Duration calculation
      • Calculate age from DOB.
      • Add and subtract days/years/months.
    • Rank cases
    • Create time series dataset.
  • II. From Analyze

    • Generate codebook of the specific variable.
    • Find the frequencies of items.
    • Generate multi- level custom tables.
    • Generate descriptive statistics from data.
    • Generate descriptive from supplied variable.
    • Generate the custom table with title, total, subtotal & not empty values with excluding variable.
    • Calculate column percentage, row percentage.
    • Calculate mean, median & minimum values of a scale variable.
  • III. Statistical Tests:

    • t-test
    • One- sample
    • Independent sample
    • Paired sample
    • Correlation (Bivariate)
    • Regression
      1. Linear regression
      2. Logistic regression
    • Reliability analysis.
    • Chi-square test
      1. One sample
      2. Test of independence
    • Non-parametric test
  • E. Data Visualization.

    • Generate charts for different types of dataset.
    • Use chart editor.
    • Export charts.
  • F. Advanced Function

    • Working with syntax.
    • Window Split for large dataset.
  • G. Project work

Upcoming Class Schedule
28 Apr 2024 10:30 AM - 12:00 PM
28 Apr 2024 08:00 PM - 09:30 PM
05 May 2024 02:00 PM - 03:30 PM
12 May 2024 12:00 PM - 01:30 PM
12 May 2024 08:00 PM - 09:30 PM

Quick Inquiry