
Stata Training in Nepal
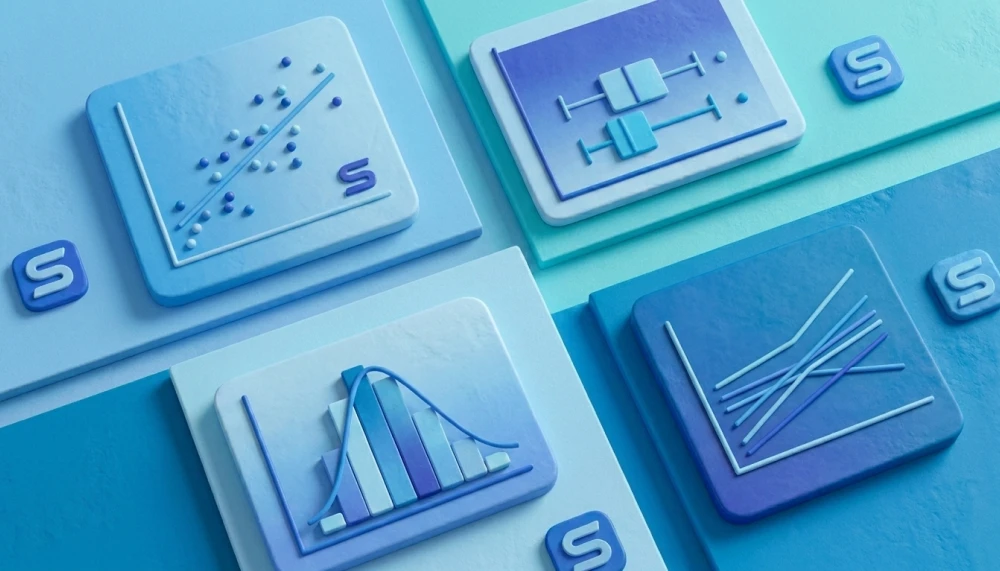
Stata Courses in Kathmandu, Nepal
STATA Training in Nepal
STATA (Software for Statistics and Data Science) is an integrated software package that helps you in your data science needs. If you are in research profession and willing to take STATA Training in Nepal, Broadway is an ideal destination. This course is designed for those students who are in the fields of economics, sociology, and political science. Thus, STATA training will help you grow in your professional life. STATA is affordable, easy to use, learn, and the trainees learn essential skills to use all the feature of data management, graphics, and statistics needed for graphic visualization and modeling of large data sets. Broadway Infosys has excellent instructors and fully equipped training labs to help students pursue the world class STATA training in Nepal.
Benefits of STATA Training in Nepal
As data is the most crucial thing in this era, learning to manipulate data will make you a highly demanded professional. Therefore, STATA can help you in smart data manipulation, visualization, statistics, and reproduce reporting too. To achieve your aim of becoming a skilled data analyst, the course offers the benefits as below:
- Learn to use broad suite of statistical features
- Learn to use compatible Version of STATA
- Handle mid-sized dataset to large datasets
- Understand Linear models and Data wrangling
- Acquire skills of data documentation and graphic visualization
- Learn about advanced programming and automatic multi-cores support
- Manage multiple datasets simultaneously
- Process text or binary data etc.
Benefits of STATA Training at Broadway Infosys Nepal
We are driven towards building skilled individuals in STATA and further add credentials to the students’ portfolio. To ensure your personal and professional development, you are heartily welcome to join Broadway for international standard STATA training course and experience the best we have to offer. You are provided with below benefits while pursuing this course at our training institute:
- Professional instructors with plenty of experience.
- Affordable training costs.
- Comprehensive training methodology.
- Wider access to training equipment and materials.
- Prepare oneself for the competitive IT market.
- Scholarship to deserving and needy students.
- Project Work under supervision of industry experts
- Job placement opportunities for ace trainees.
- Career opportunities for candidates wanting to specialize in data analysis
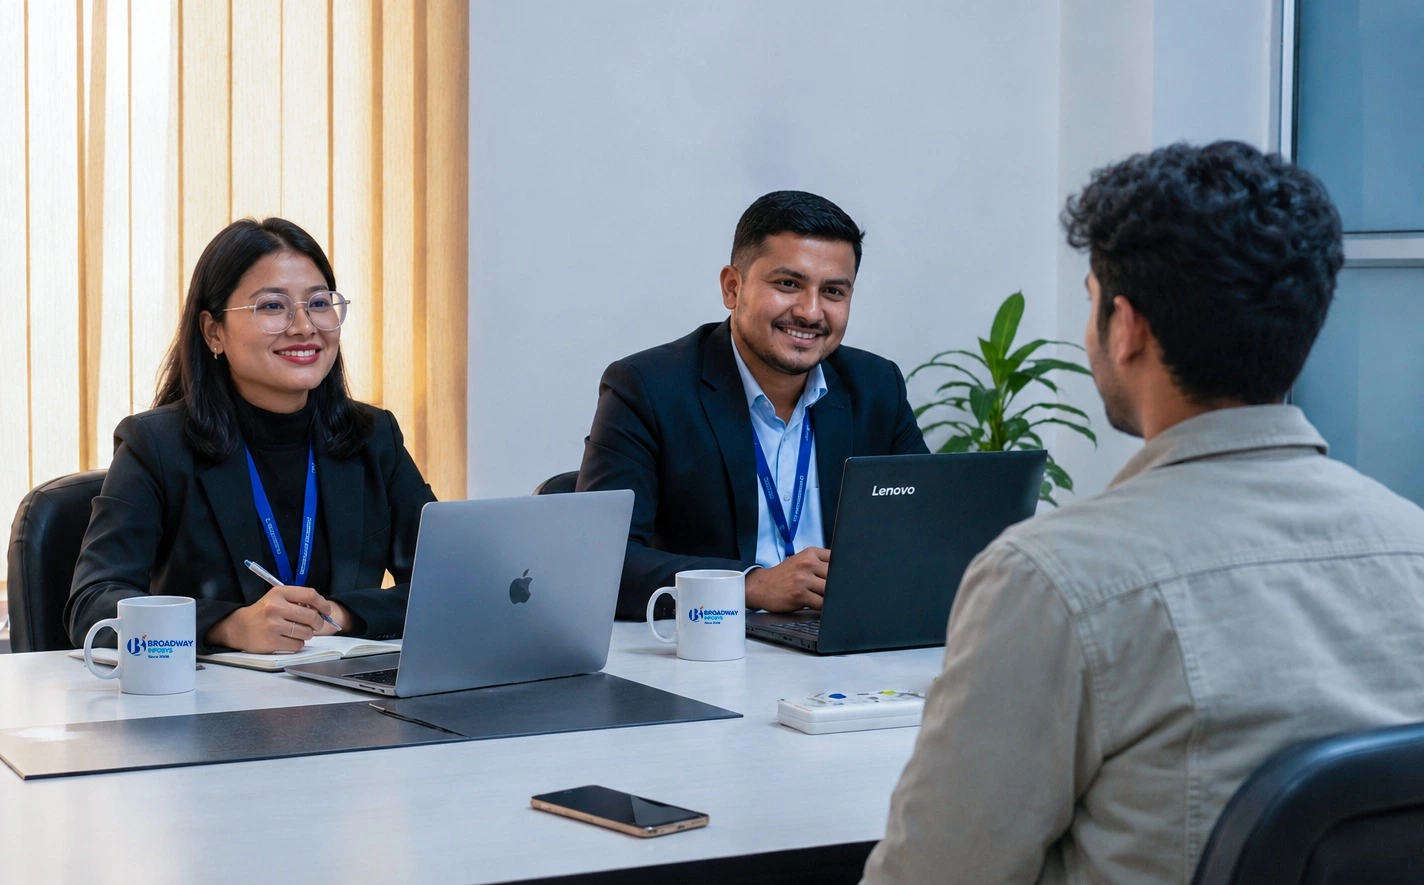
Our network with several research based organizations and data management focused companies is the key to our students’ placement. Please feel free to connect us via our website, social media or directly visit us. We want to make sure you secure your seats at the earliest for our upcoming STATA training session.
-
Syllabus of Stata Training
Stata basics
- Tour of the Stata 14 interface
- Quick help
- PDF documentation
- Example datasets included with Stata
-
Data management
- Loading, saving, importing, and exporting data
- Importing FRED (Import Federal Reserve Economic Data)
- Copy/paste data from Excel into Stata
- Importing Excel data into Stata
- Saving estimation results to Excel
- Importing delimited data
- Changing and renaming variables
- Converting a string variable to a numeric variable
- Converting categorical string variables to labeled numeric variables
- Creating a categorical variable from a continuous variable
- Converting missing value codes to missing values
- Combining data
- Merging files into a single dataset
- Appending files into a single dataset
- Creating and dropping variables
- Creating a new variable that is calculated from other variables
- Identifying and replace unusual data values
- Creating a date variable from a date stored as a string
- Optimizing the storage of variables
- Rounding a continuous variable
- Stata's Expression Builder
- Examining data
- Identifying and remove duplicate observations
- Labeling, display formats, and notes
- Labeling variables
- Labeling the values of categorical variables
- Changing the display format of a variable
- Adding notes to a variable
- Reshaping datasets
- Reshaping data from wide format to long format
- Reshaping data from long format to wide format
- Strings
- Unicode
-
Graphics
- Transparency in Stata graphs
- Bar graphs
- Box plots
- Contour plots
- Histograms
- Pie charts
- Basic scatterplots
- Stata's Expression Builder
-
Automated document and report creation
- Creating PDF reports from within Stata
- Creating Word documents from within Stata
-
Econometrics and Binary, ordinal,count,fractional outcomes
- Logistic regression in Stata, part 1: Binary predictors
- Logistic regression in Stata, part 2: Continuous predictors
- Logistic regression in Stata, part 3: Factor variables
- Regression models for fractional data
- Logit and Probit Models
-
Hypothesis tests & Descriptive statistics, tables, and cross-tabulations
- One-sample t-test
- t-test for two paired samples
- t-test for two independent samples
- Descriptive statistics
- Tables and cross-tabulations
- Combining cross-tabulations and descriptive
- Pearson’s chi2 and Fisher’s exact test
-
Linear models
- One-way ANOVA
- Two-way ANOVA
- Analysis of covariance
- Simple linear regression
- Pearson’s correlation coefficient
-
Power and sample size
- An introduction to power and sample size
- Sample-size calculation for comparing a sample mean to a reference value
- Sample-size/power calculation for comparing a sample proportion to a reference value
- Sample-size/power calculation for comparing sample means from two paired samples
- Sample-size/power calculation for one-way analysis of variance
-
Statistical calculators
- Cross-tabulations and chi-squared tests calculator
- One-sample t-tests calculator
- Two-sample t-tests calculator
- Incidence-rate ratios calculator
- Odds-ratios calculator
- Risk-ratios calculator
-
Survey data analysis
- An introduction to the analysis of complex survey data
- Specifying the design of your survey data
- Multilevel models for survey data
- Survey data support for SEM.
-
Survival analysis
- Interval-censored survival models
- Set up your data for survival analysis
- Describe and summarize survival data
- Construct life tables
- Calculate incidence rates and incidence-rate ratios
- Graph survival curves
-
Time series
- Formatting and managing dates
- Time-series operators
- Correlograms and partial correlograms
- Line graphs and tin()
-
Project work
Quick Inquiry
Gain Professional IT Skills via Online Means!
